Monitor
The monitor module is used to record and view server performance data, including CPU, memory, disk I/O, and network traffic.
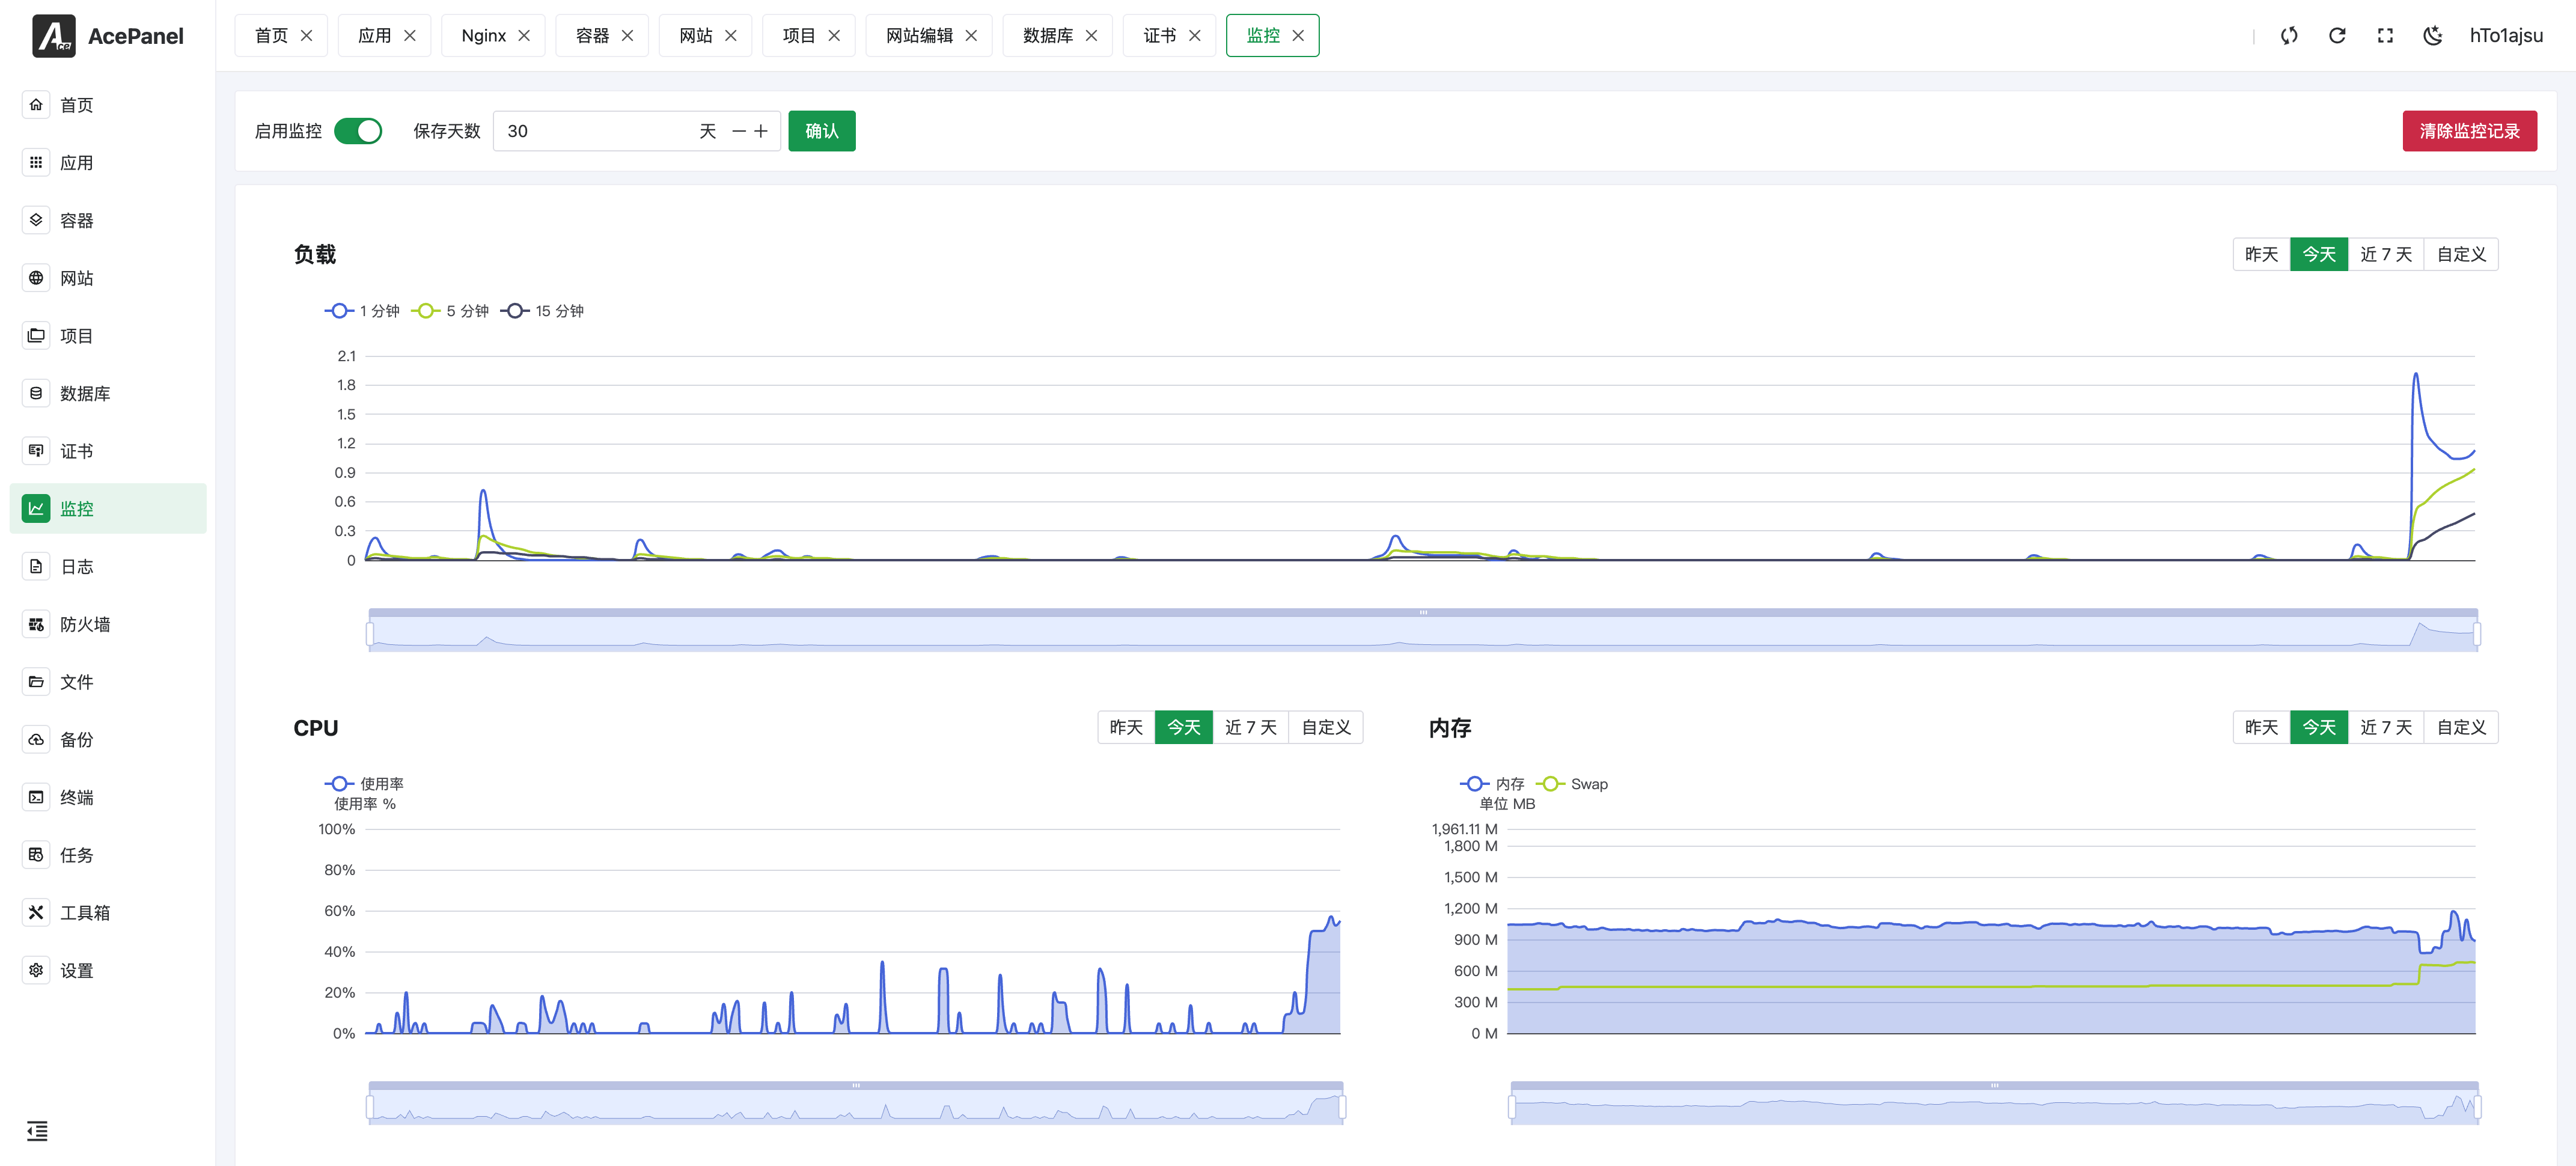
Monitor Page
Monitor Settings
Enable Monitoring
After turning on the Enable Monitoring switch, the system will periodically collect performance data.
Save Days
Set the retention time for monitoring data, default is 30 days (range 1-365). Data exceeding the retention time will be automatically cleaned up.
Collection Interval
Set how often performance data is collected, default is 1 minute (range 1-120 minutes). A larger interval reduces the amount of data stored at the cost of lower granularity.
Clear Monitoring Records
Click the Clear Monitoring Records button to manually clear all historical monitoring data.
Monitoring Metrics
Load Average
System load reflects the busyness of the CPU:
- 1-minute load: Average load over the last 1 minute
- 5-minute load: Average load over the last 5 minutes
- 15-minute load: Average load over the last 15 minutes
Load value reference:
- Load < CPU cores: System running smoothly
- Load = CPU cores: System running at full capacity
- Load > CPU cores: System overloaded, may experience lag
CPU Usage
Displays the overall CPU usage percentage (0-100%) over time. Hover over the chart to see the Top 5 processes by CPU usage at that point in time.
Memory Usage
Displays memory usage in MB:
- Used memory
- Swap usage
Hover over the chart to see the Top 5 processes by memory usage at that point in time.
Disk I/O
Displays disk read/write speed:
- Read speed (KB/s or MB/s)
- Write speed (KB/s or MB/s)
Use the checkboxes to choose which disk devices to display (all are selected by default). Hover over the chart to see the Top 5 processes by disk I/O, including their total read and total write.
Network Traffic
Displays network interface traffic:
- Upload speed
- Download speed
Use the checkboxes to choose which network interfaces to display (all are selected by default). The loopback interface (lo) is excluded.
Time Range
Each monitoring chart supports selecting a time range:
- Yesterday: View yesterday's data
- Today: View today's data
- Last 7 days: View data from the last week
- Custom: Select any time range
Use Cases
Performance Analysis
Analyze server performance bottlenecks through monitoring data:
- Sustained high CPU load: Consider optimizing programs or upgrading CPU
- Insufficient memory: Consider adding memory or optimizing memory usage
- High disk I/O: Consider using SSD or optimizing database queries
- Insufficient network bandwidth: Consider upgrading bandwidth
Troubleshooting
When problems occur, view historical monitoring data to locate the time and cause of the problem.
Capacity Planning
Based on historical data trends, predict future resource needs and plan for expansion in advance.
Notes
- Monitoring data will occupy some disk space
- The longer the retention days, the more space it occupies
- It is recommended to set appropriate retention days based on actual needs